For my third assignment, I decided to use the code a Constructor Function within p5.js to create a visual simulation of Red Blood Cells (RBCs) floating around in plasma (fluid present in the blood).
My inspiration for the project was watching similar animations and videos for my biology class, which I always found useful tools of study.
As a science student in high school, I always found it helpful to look at visual simulations of biological phenomena such as cell replication or composition of the human blood in order to better understand the dynamics of what was going on. While I often resorted to animations and YouTube videos on the human cell, nerve impulses, expansion and contraction of the lungs etc.., I have always been fascinated by and curious about how tech-savvy programmers and biologists create such incredible, visibly simulating and moving animations of complicated biological phenomena.
One of the most fundamental material covered in any high school biology course is the composition of the human body, which includes the study of the circulatory system, the skeletal and muscular systems, the nervous system, the respiratory system , the excretory system etc.. Therefore, as a starting point, I decided to depict the presence of RBCs in plasma (blood fluid).
I turned to Google images as well as my own memory of how RBCs appeared.

Red blood cells have a disc-like biconcave shape, which gives them additional surface area to absorb and exchange oxygen. They are enucleated (without a nucleus) and flow through the blood via the circulatory system to deliver oxygen from the lungs to the body tissues.
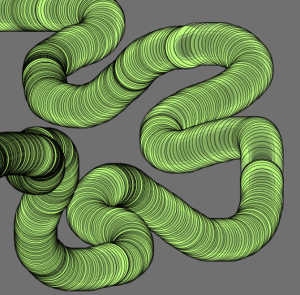
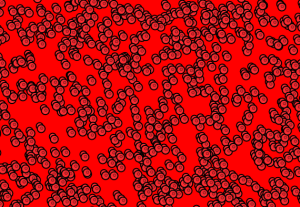
My project shows the the disc-like, enucleated RBCs flowing through the blood stream (depicted by the red background).
In terms of the movement, I chose a uniform lateral movement; using the
“this.x = this.x + 2”
code within the “move” function of the “Cell” Constructor Function.
In addition to the horizontal movement across the screen, I chose a slight up-and-down movement to make the animation seem more intuitive. For that, I implemented the code
“this.y = this.y + random(-1, 1)”
again within the “move” function in the “Cell” function.
I designated the constructor function as the “Cell” function and included the “display” and “move” functions within it.
Professor Shiffman’s YouTube tutorial, 6.4 ‘The Constructor Function in JavaScript’ helped me implement the Constructor Function using the code
“cells[i]= new Cell();”
within the “Setup” function and by creating the variable “cells”.
The actual video at first appears like this:
The main challenge that I faced while working on putting together my code for this project was making the cells flow undisrupted. Unfortunately, the cells start “flowing” into the screen (plasma) from the left hand side of the screen and exit smoothly through the right side of the screen but after a bit, they stop coming in from the left hand side.
I was not entirely successful in making the red blood cells appear continuously from the left hand side and this literally “breaks the flow” of the cell movement.
I realized that I cannot apply the “Bouncing ball” operation to solve the problem of my moving and abruptly stopping red blood cells as it is neither intuitive nor realistic for red blood cells to bounce back (unless of course, there is some sort of blockage that leads to hemorrhage, which is not my intention to show in this animation of RBCs in a healthy body).
After many attempts to come up with a solution to this problem, I still have to take my professor’s advise in order to figure out how to make the cells keep appearing continuously on the screen.
Apart from that problem, I realized the power of the constructor function in JavaScript as a sort of “container” (to use Professor Shiffman’s word from the video) of various other functions to avoid repetition of the entire coding syntax and to lend reusability to the function.
Finally, with some help from Professor Shiffman, I figured that the answer to getting the cells to continuously stream into the screen was simply using the “if” command within the move” function as follows:
“if (this.x > width + 10) {
this.x = 0;
}
The above allows the cells to reset themselves once the this.x value exceeds (screen width + 10) so that the this.x coordinate of the cells takes the value 0 once they cross the value (screen width + 10), giving the user the impression that the cells are flowing into the “plasma” (computer screen) continuously.
So, the final animation looks like the following:


 Here are few of my notes!

 Myriad of chem apps are available nowadays.
 HCl + NaOH -> NaCl + H2O


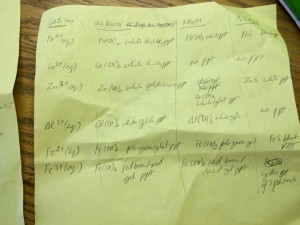
 This is a still image of the notes.
 Here’s the Apple mosaic!